Overview
The application is split into 5 modules that are available from the top of the screen: Home, Geometry, Measurement, Analysis and Animation. They correspond to different parts of the experimental modal analysis procedure.
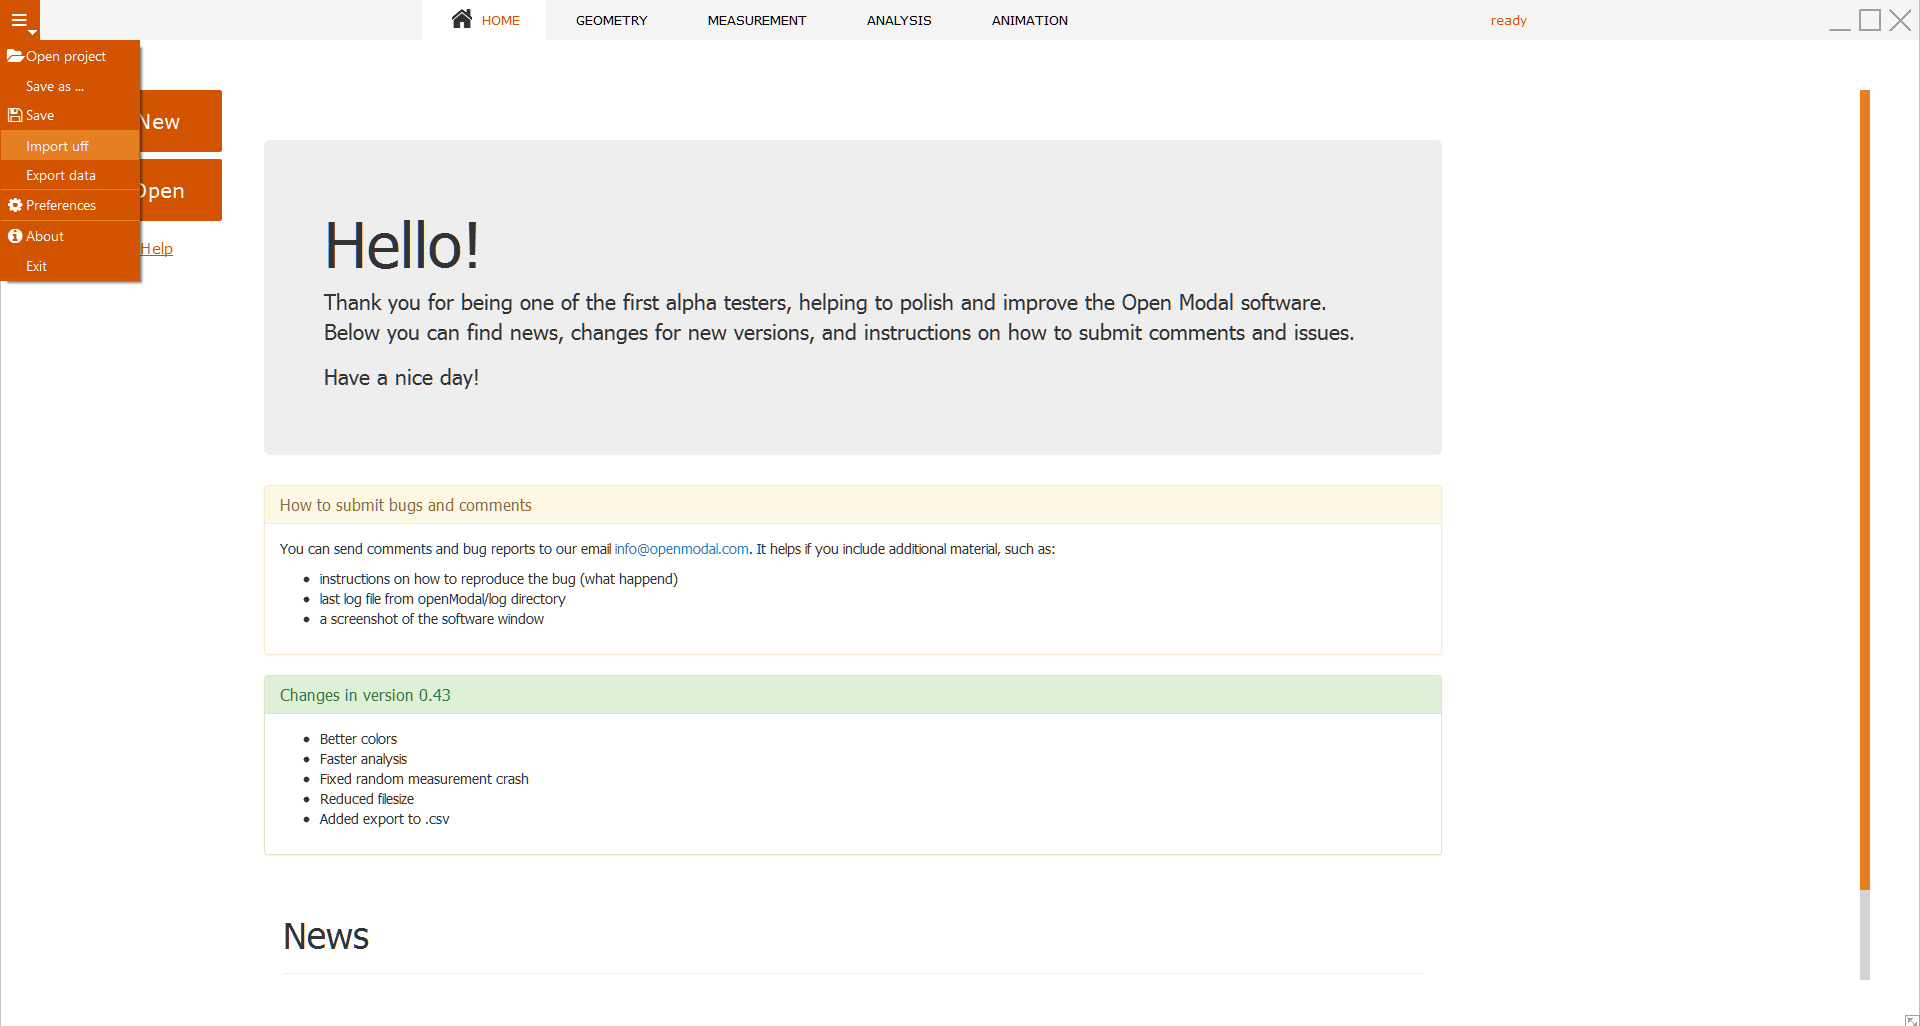
You will want to start either by creating the geometry from scratch by selecting Geometry in the top-most area, or by importing existing data. Existing projects can be loaded by pressing the button Open or a UFF file can be imported by choosing the option Import uff in the top-left menu. This menus also offers other features, such as to Save the work in progress or to Export data to different formats.
Models
There is a models system available throughout OpenModal and a 'New Model' is created for you automatically. If needed, additional models can be created meaning that multiple geometries and corresponding measurements can coexist within the OpenModal project. This should bbe useful for comparison of different experiments and geometry variations.
Geometry
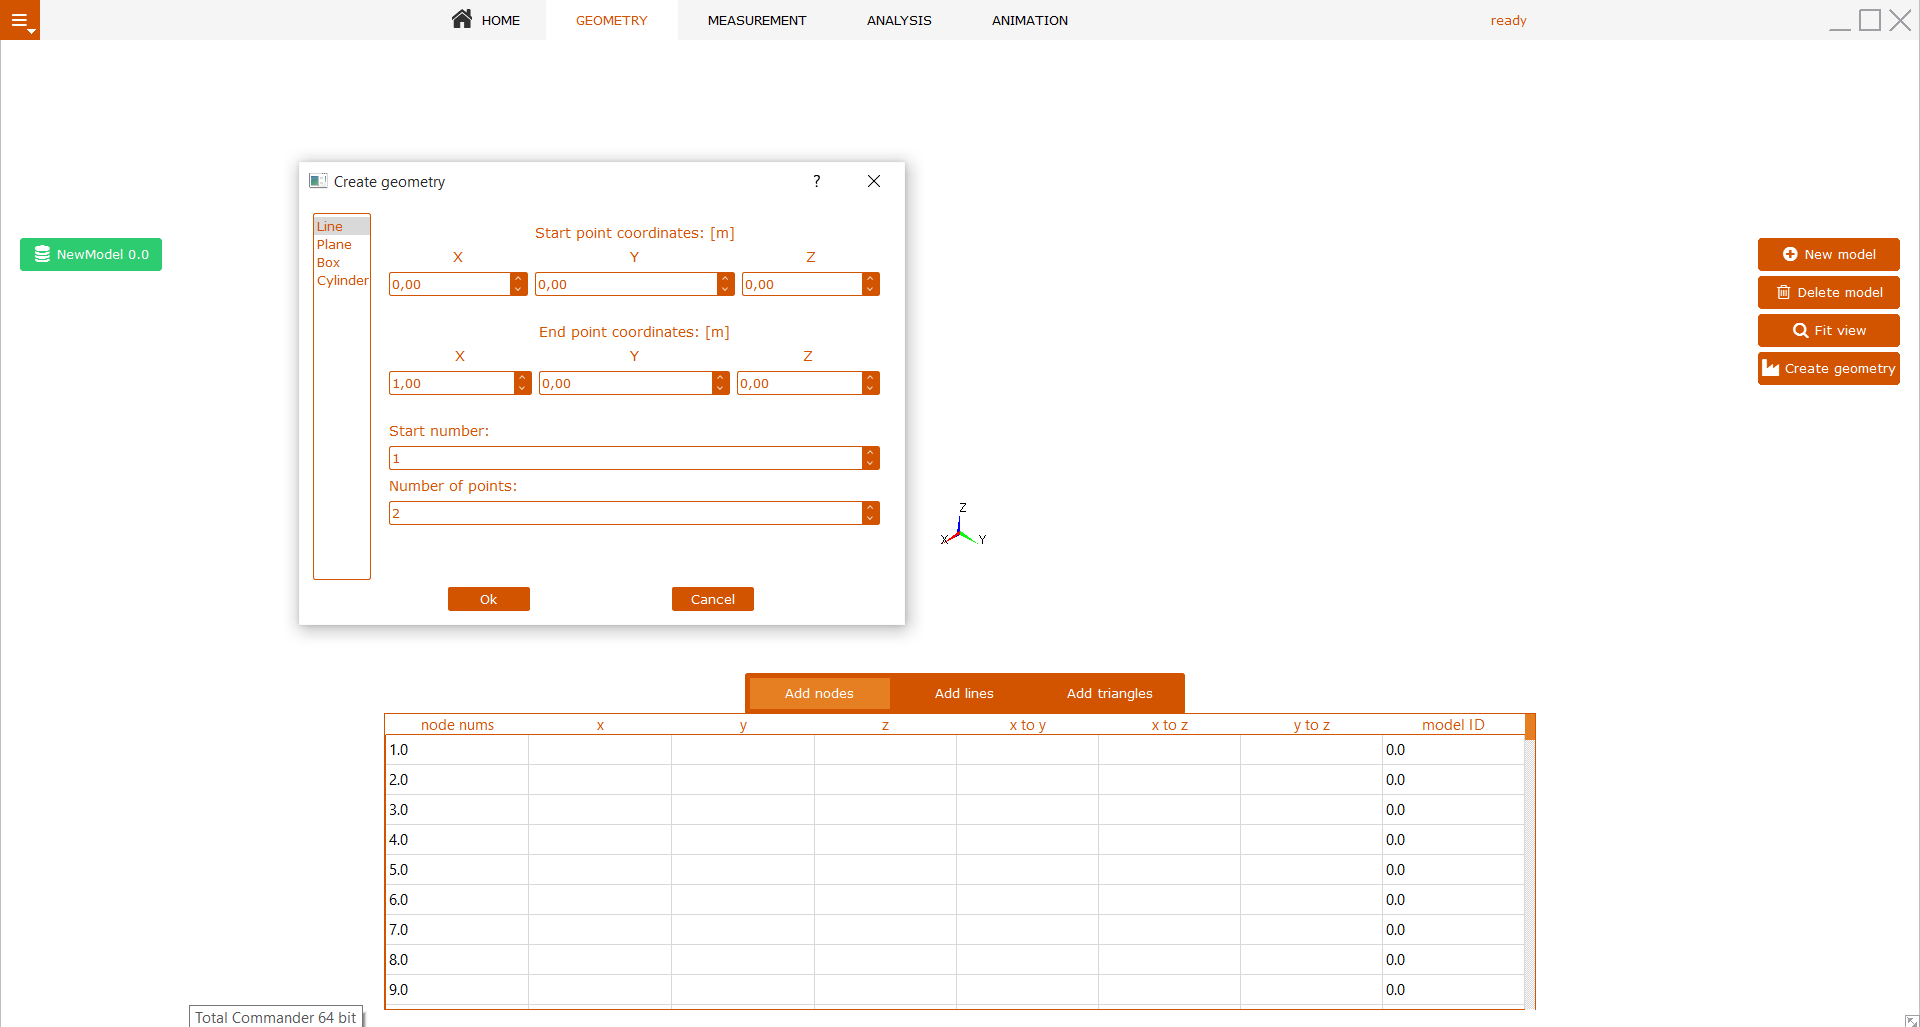
Geometry module offers tools for node and element generation. The tables at the bottom of the screen hold nodes, their coordinates and coordinate systems. There are separate tables for elements, such as lines and triangles. The best way to start probably is to use the Create geometry wizard accessed from the right-hand side. A large number of nodes is then easily generated by specifying the boundaries for line, plane, box or cylinder types of surfaces.
Take special care to assign the correct euler angles to your nodes to avoid problems during the later steps of the experimental modal analysis. You can take advantage of the copy/paste functionality of the tables to quickly adjust parameters for a large amount of nodes or to copy/paste values from clipboard into OpenModal. Once you have generated all the necessary geometry you can continue with measurements. It is also possible (while not recommended) to do measurements first and assign nodes later.
Manipulating graphic objects
OpenModal uses a very powerful visualization library that takes full advantage of the GPU unit. Both 3D views (geometry model) and 2D views (plots) can be manipulated effortlessly using your mouse. Also, be sure to always check the right-click menu in these windows, as it might contain some very useful stuff.
Measurements
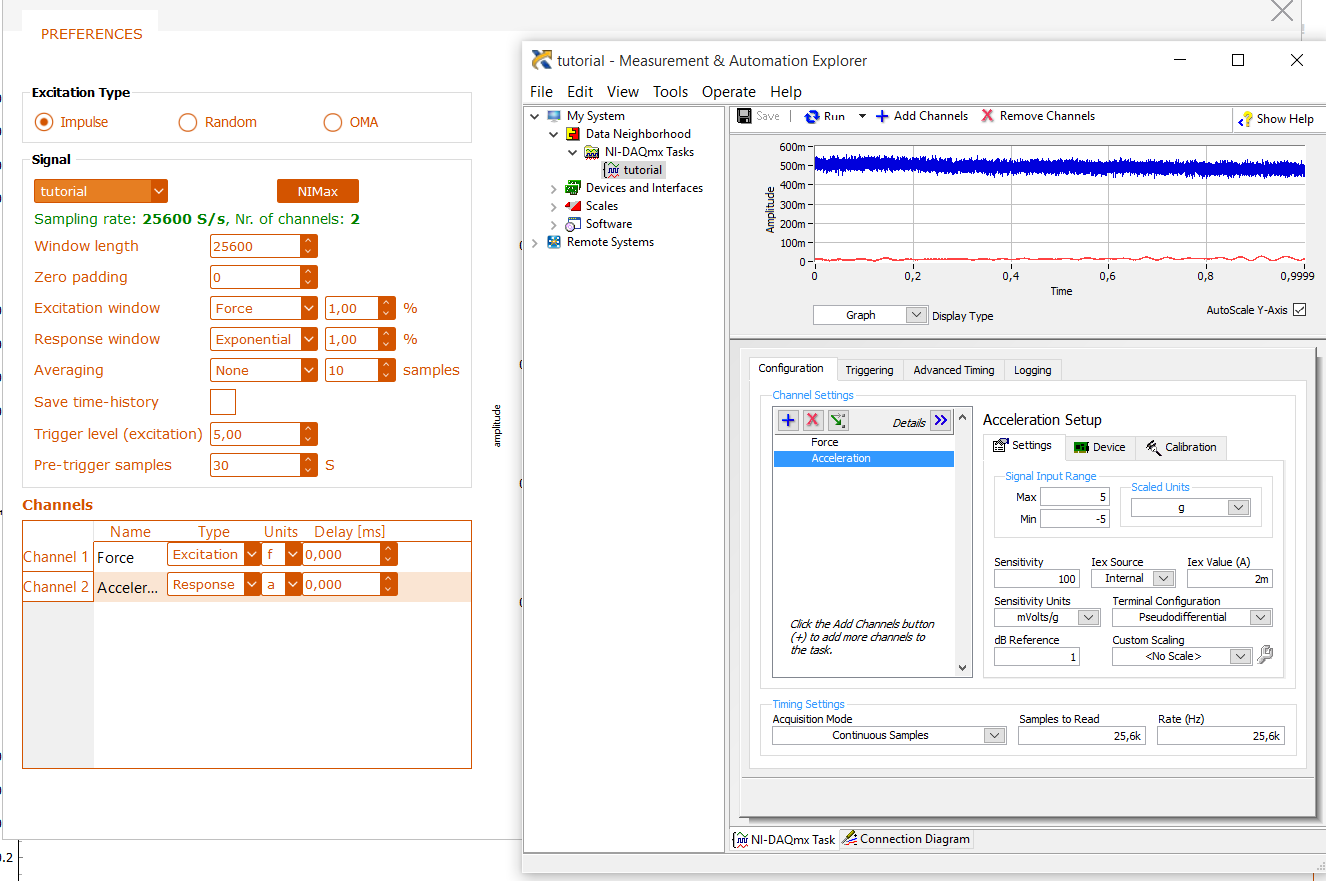
The measurement window is used to acquire experimental data. First thing to do here is to open the configuration window and configure hardware. Only National Instruments hardware is supported within OpenModal at the moment. Type of analysis must be specified at this point, and can be any of the following: impulse, random or OMA (operational modal analysis) type. Please be aware that different types of measurement can require quite different configurations. Leave the configuration window when everything has been set.
Hardware
OpenModal requires National Instruments (or other DAQmx supported hardware) at the moment. The interface must be setup first by preparing a Task within the NI MAX (Measurement and Automation Explorer) tool. Once saved, these tasks are accesible within OpenModal and can be used to perform measurements. If your system does not have DAQmx drivers installed you can still use OpenModal but will have to rely only on data you can import.
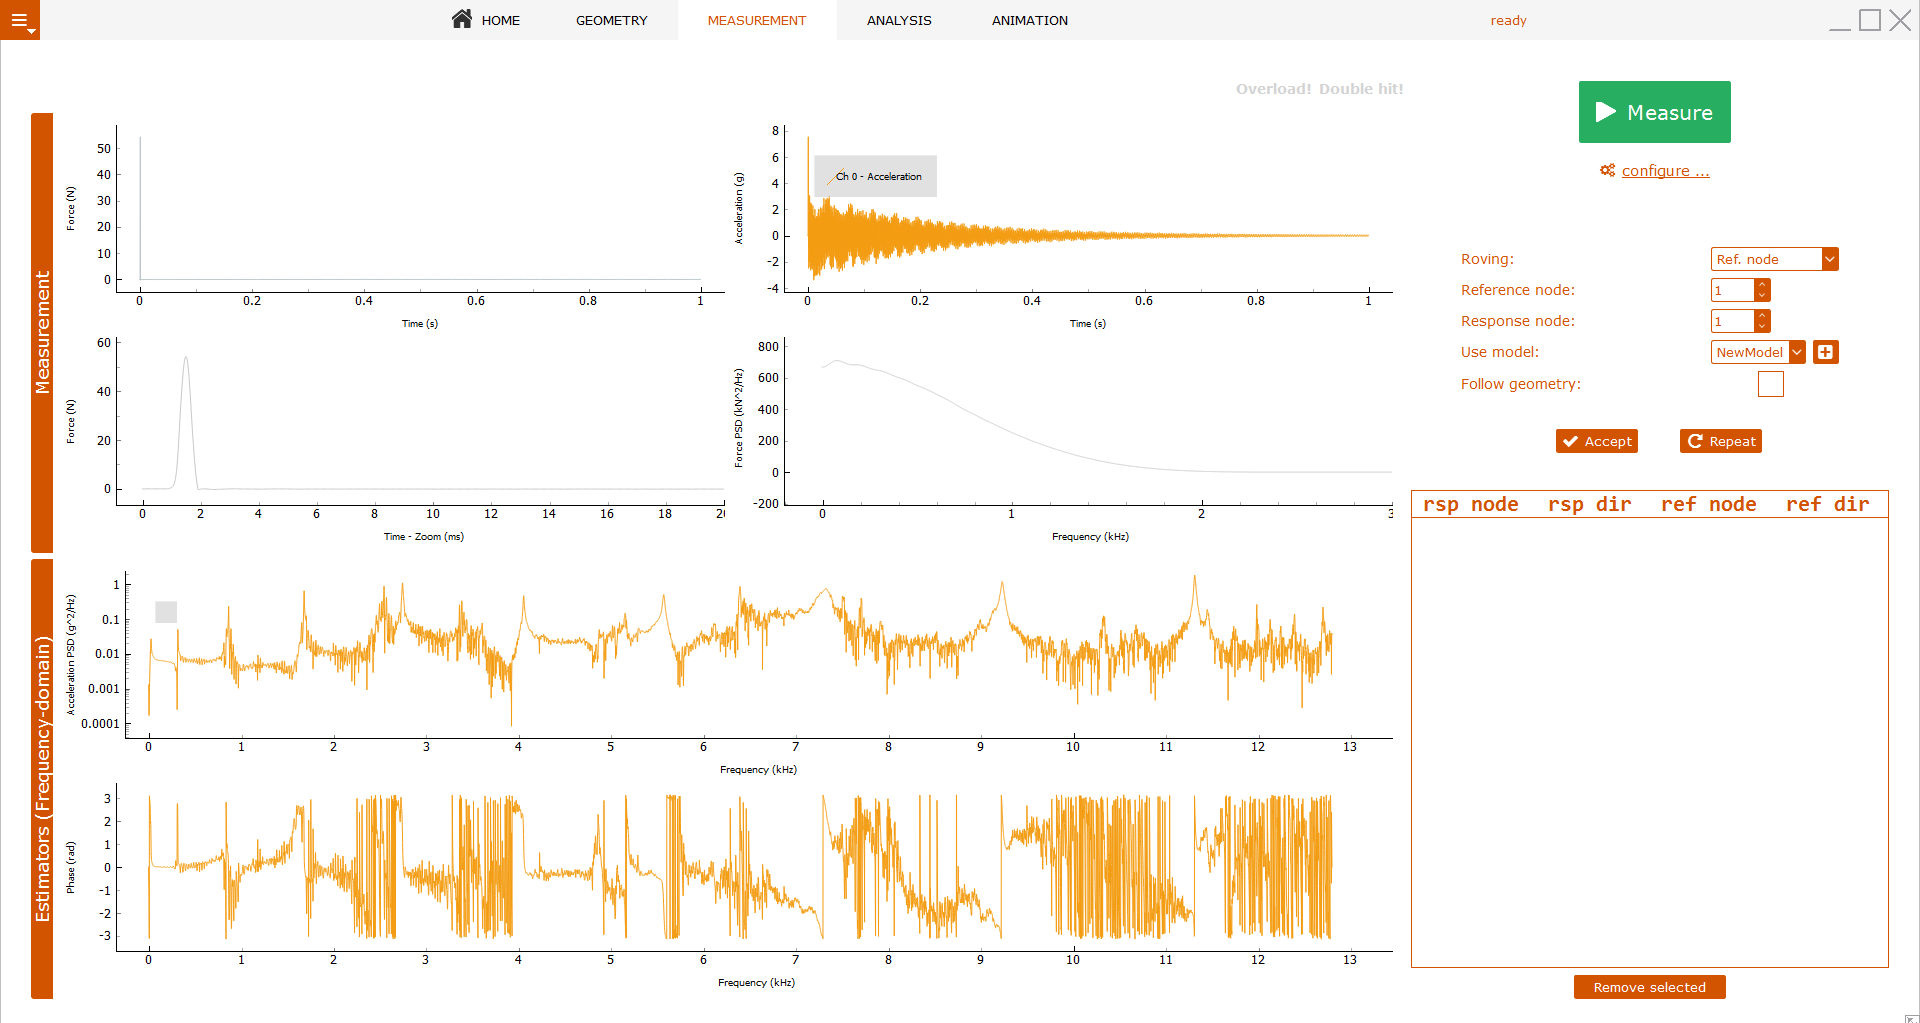
Back in the main window, all that is needed to start the measurement is to press the Measure button. In the case of impulse measurement that is outlined in this guide, the software will wait for a peak in the force excitation signal and then measure one window of data. You can choose to Accept this measurement, in which case it is added to the table below. You can also choose not to accept it and instead Repeat the process. There is a number of plots on screen which show different details of measured data. These are (left to right, top to bottom): excitation signal, response signal/s, zoomed-in excitation, PSD of excitation, and finally amplitude and phase frequency diagrams.
All values within the table should correspond (through node number) to the nodes (geometry) of the model when the measurements are complete. If there are discrepancies the table entry values can be changed by selecting an entry and typing in a different value.
Modal analysis
Analysis can be performed once the measurements are present within the OpenModal project. Usually they are limited to a frequency band which can be set by specifying the minimum and maximum frequency on the right-hand side. The analysis is then performed by a click on the Analyze button which draws additional layer of calculated poles (natural frequency and damping ratio) which must be selected by the user and are represented in the table on the right-hand side.
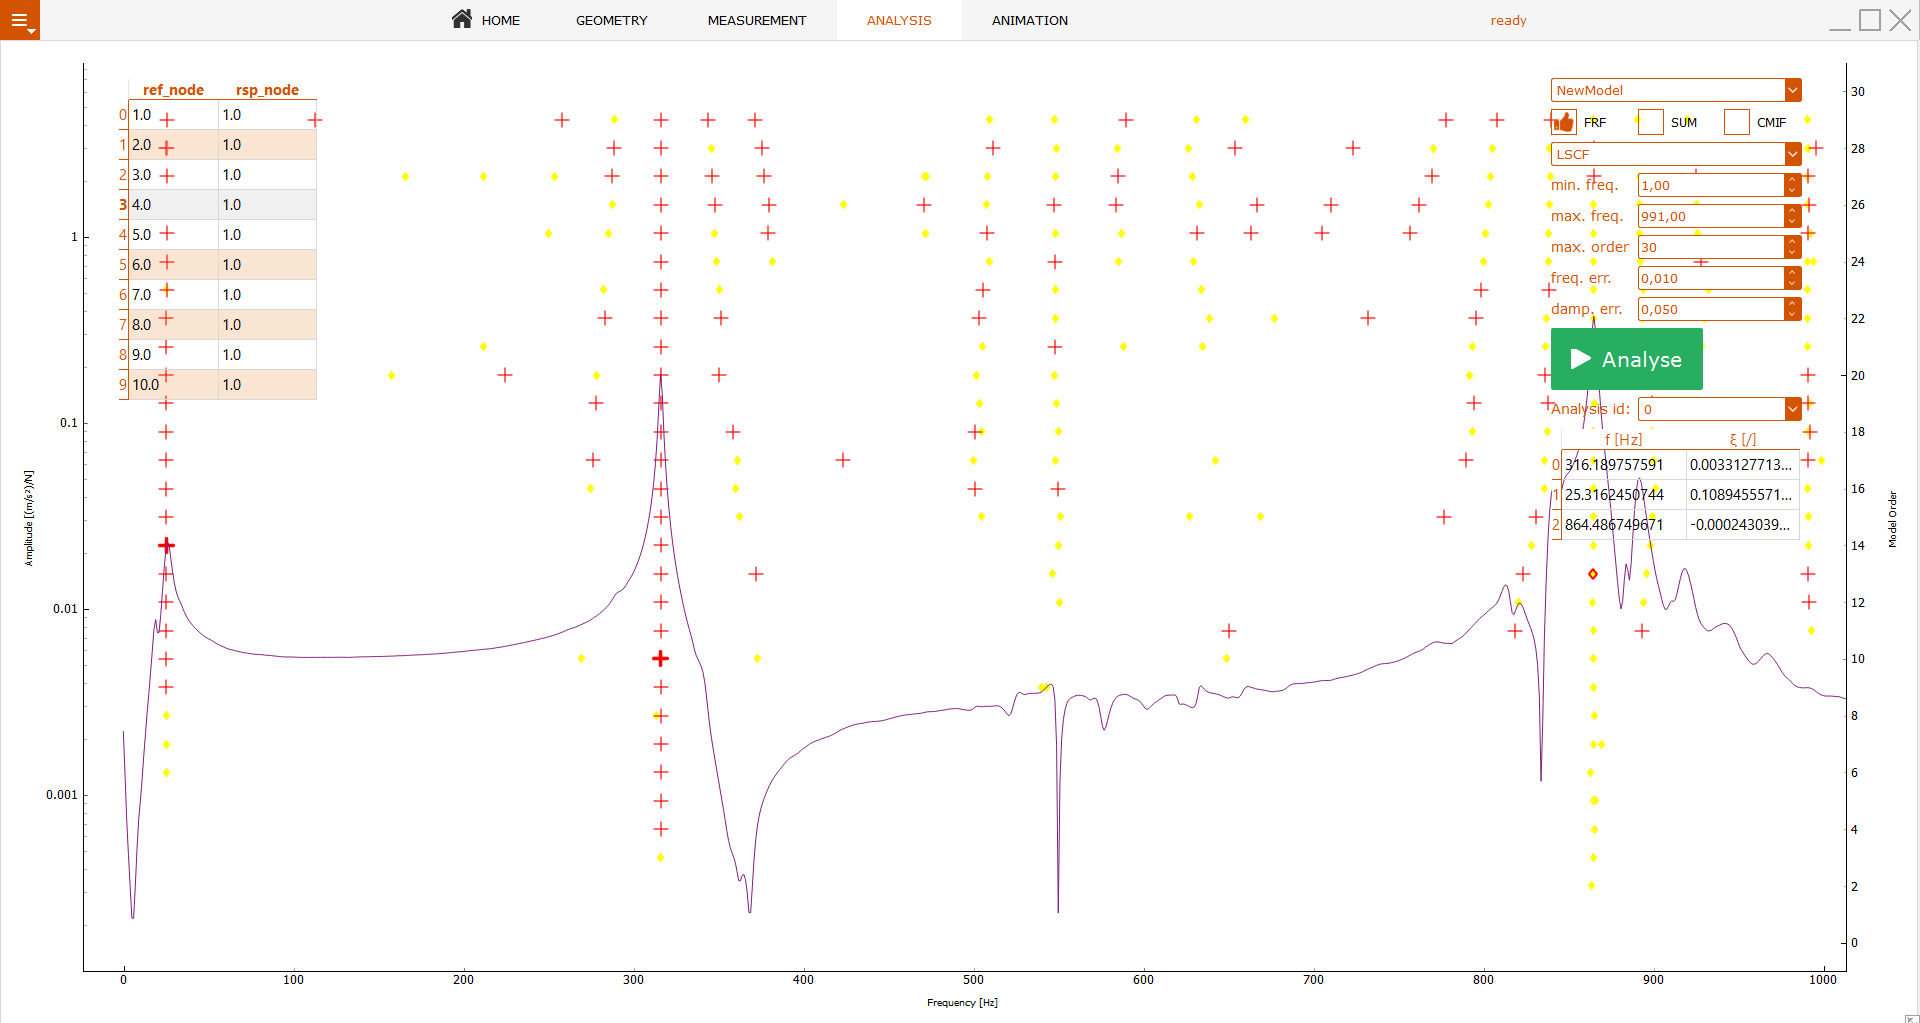
Modal identification estimators
Modal parameters are identified by curve-fitting a set of Frequency Response Functions or Impulse Response Functions. In general, curve fitting is a process of matching a mathematical expression to a set of empirical data points. The Least-Squares Complex Frequency Domain estimator (LSCF) and the Least-Squares Complex Exponential estimator (LSCE) methods are currently supported within OpenModal of which the first one is the default choice. Both methods estimate the poles which are represented by red plus signs (both natural frequency and damping are stable) or yellow triangles (only natural frequency is stable).
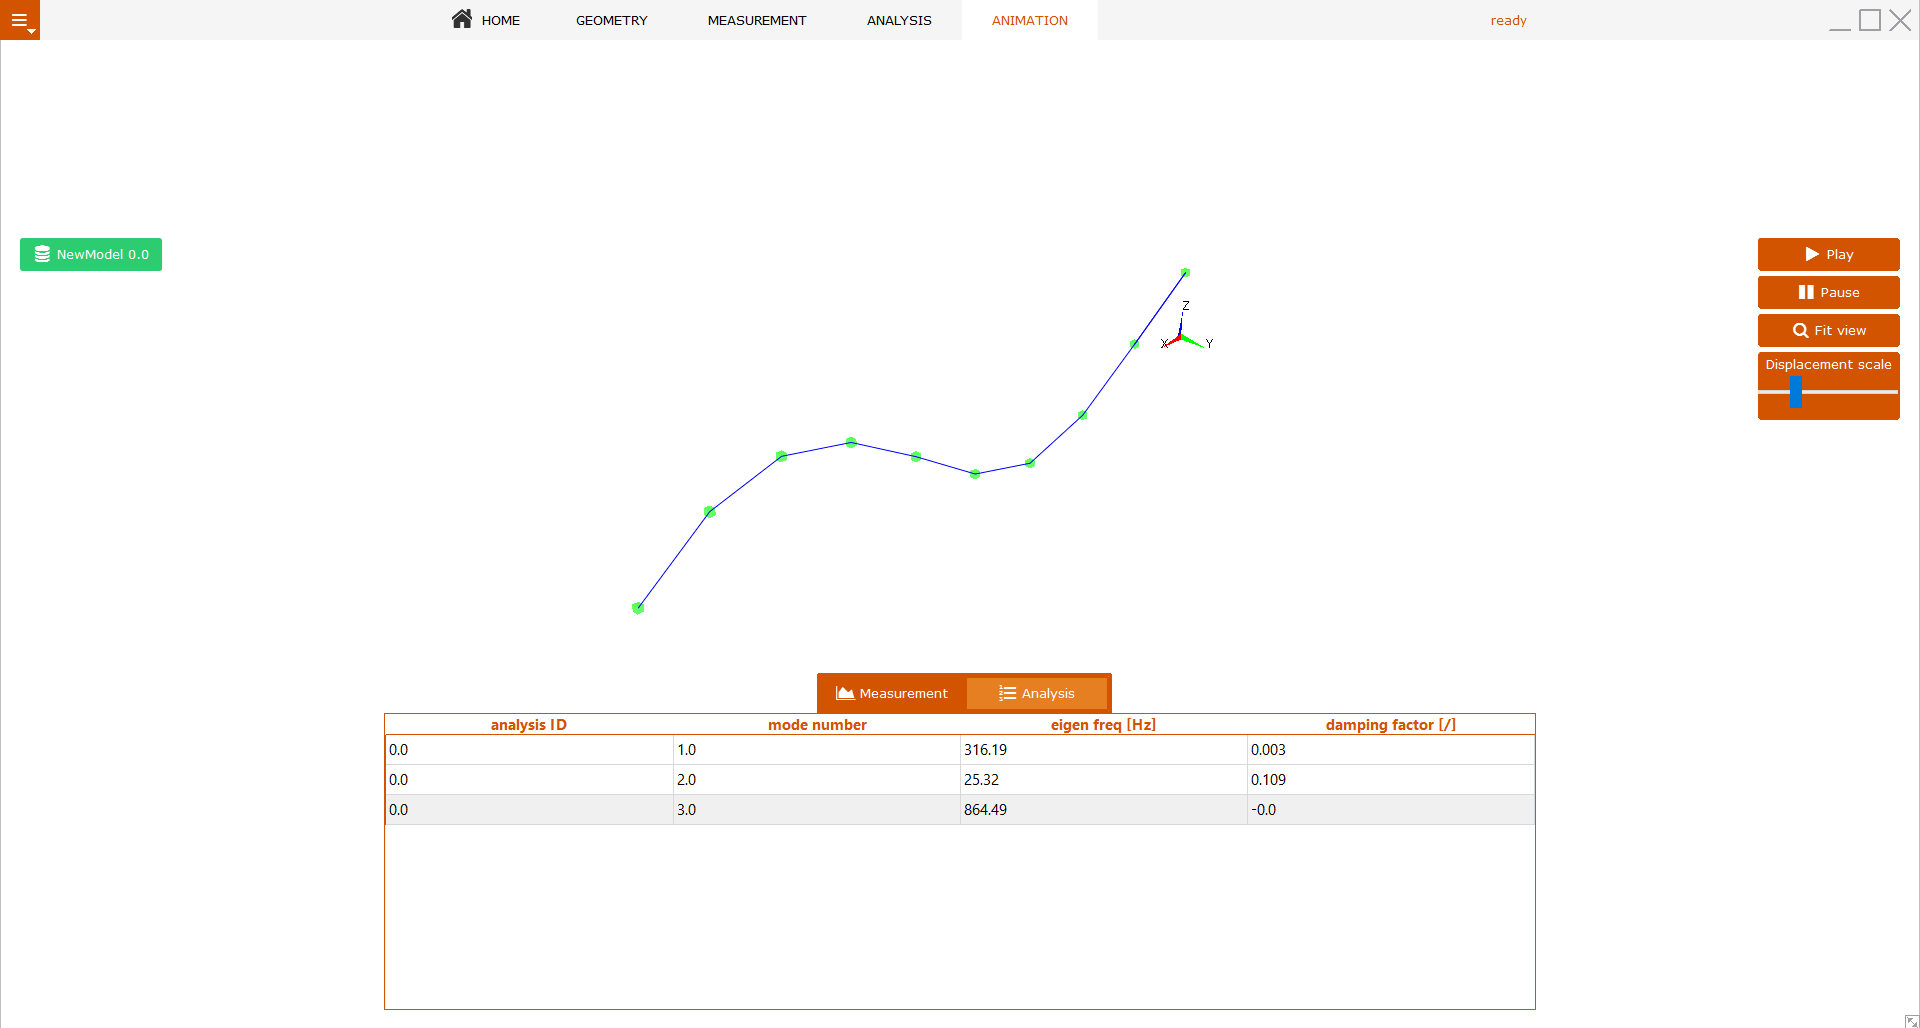
Visualization
Measured and analyzed data can be visualized within the animation module. By clicking on a certain point on the plot, a frequency is selected and the model is animated accordingly by pressing Play. Distinct modal shapes can also be animated by selecting the Analysis table tab. Check the right-mouse-button menu for additional options.
Watch the video
Video of a complete experimental modal analysis procedure.